cover for metrics dashboard upgrade project

Metrics Dashboard Upgrade

To pinpoint their most engaged donors and detractors, we upgraded our metrics dashboard by adding features that empowered our users to own and analyze their data. Over 6 months, these new features resulted in an increase to metrics page visits by 15% and improved platform averages by 6% while saving users over 60% of time required to analyze their data.

PROJECT FOR

ThankView

Timeframe

July 2020 - August 2021

Role

UI/UX, Research, Strategy, Analytics

Team

1 Designer, 3 Developers

Fundraising in a Covid World

Return on investment (ROI) is a primary key performance indicator for stewardship teams to understand if a donor is worth investing resources and time into. If the teams do not believe a donor has potential lifetime value, they will spend their time and dollars elsewhere. Stewardship is a laborious process that involves engagement in multiple touch points across various mediums, including offline and online methods - thus making time/effort vs. dollars the most valuable indicator for ROI.

Pre-2020, stewardship teams relied heavily on in-person engagements such as events. With the presence of the Covid-19 pandemic, entire organizations had to rethink their approach to digital, especially in the case of stewardship. This is where ThankView comes in.

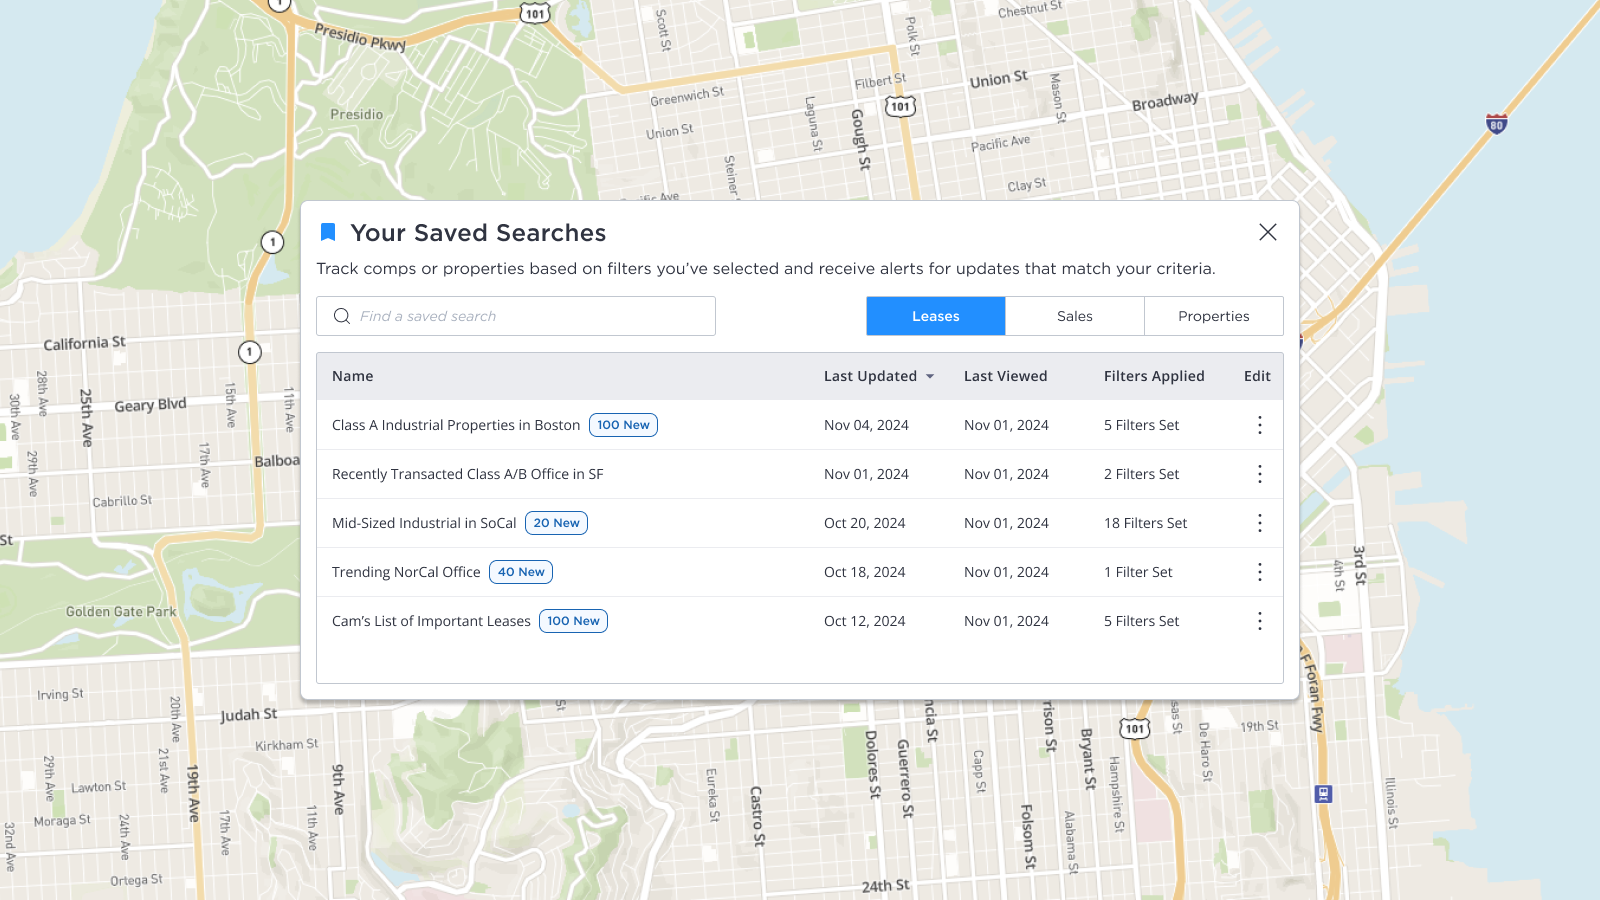
ThankView has a dedicated metrics page for users to see the performance of their campaigns across a set period of time. Since I started in 2019, users could only see high level campaign data in the last 7 days, 30 days, or 365 days. In order to analyze more granular data, the user was required to download the report as a .CSV and analyze it themselves. Our metrics page was a limited experience that provided some insight into ROI, but not a full picture of performance.

In order to build a better experience for our users, we conducted extensive user research (8 users) and surveys (74 users) and analyzed our internal metrics to discover:

  • 30% of churn was a result of users not having visibility into their ROI with ThankView, resulting in thousands of lost recurring revenue
  • 80% of users mentioned that they did not have spare time in the day to analyze their data more granularly (e.g. filtered segments)
  • 50% of teams rely on a separate data team to help them analyze information, which took an additional 2-3 weeks to get insights
  • Only 56% of teams were actually going to the metrics page after they launch a campaign

Customizable Date Ranges

Sometimes the most difficult pain points require the simplest solutions. Insight from our customer success team actually taught us that some organizations have different quarterly start/end dates (while most Q1s start in January, some start in February or later). With the default values that we had before, these teams were not able to pull the relevant range of data to analyze.

To address this, we designed the ability for users to select customize date ranges.

Results

  • The ability to choose any set of date ranges they wanted
  • 70% usage rate in 6 months

Contact Level Metrics

Donor relation and stewardship requires teams to understand donors at a more focused level. Previously, users would have to manually download data and create pivot tables to get the slices of data they wanted to analyze. To simply this process, building a Contact Level Metrics view gave users the ability to click into a specific metric they wanted to dive deeper into on a contact level, including a Clicked, but Didn't Watch view that would typically require a much more complex setup.

Results

  • 75% usage rate in 6 months
  • Users saved 80% of clicks to see the same data
  • For organizations reliant on separate teams for metrics, they saved 2-3 weeks of time by being able to analyze the data themselves

Advanced Filters

Users who were more data-savvy often wanted different segments to their data, especially to measure the impact of a set of campaigns against each other. Advanced filters allowed users to segment their data in ways that they wanted to analyze it with as many conditions as they wanted. Our systems also accounted for any conflicting conditions (e.g. Last Donation is less than $50 and more than $100) to ensure that users could not run filters that broke their data.

Results

  • 99% increase in data segmentation variations and combinations
  • 20% usage rate in 3 months

So What's Next?

Building meaningful and actionable dashboards is a non-stop endeavor. As we expand our metrics capabilities, we look to continue adding value to the dashboards we build. In our backlog, we currently have the features planned: