Project Synopsis
Saved searches are one of CompStak’s most valuable features—both for users and for the business. They eliminate repetitive query-building, accelerate workflows, and allow users to easily monitor trends in their focused sector. They also serve as a major engagement driver for the business—bringing users back through email alerts, strengthening platform stickiness, and reinforcing CompStak’s role in daily workflows.
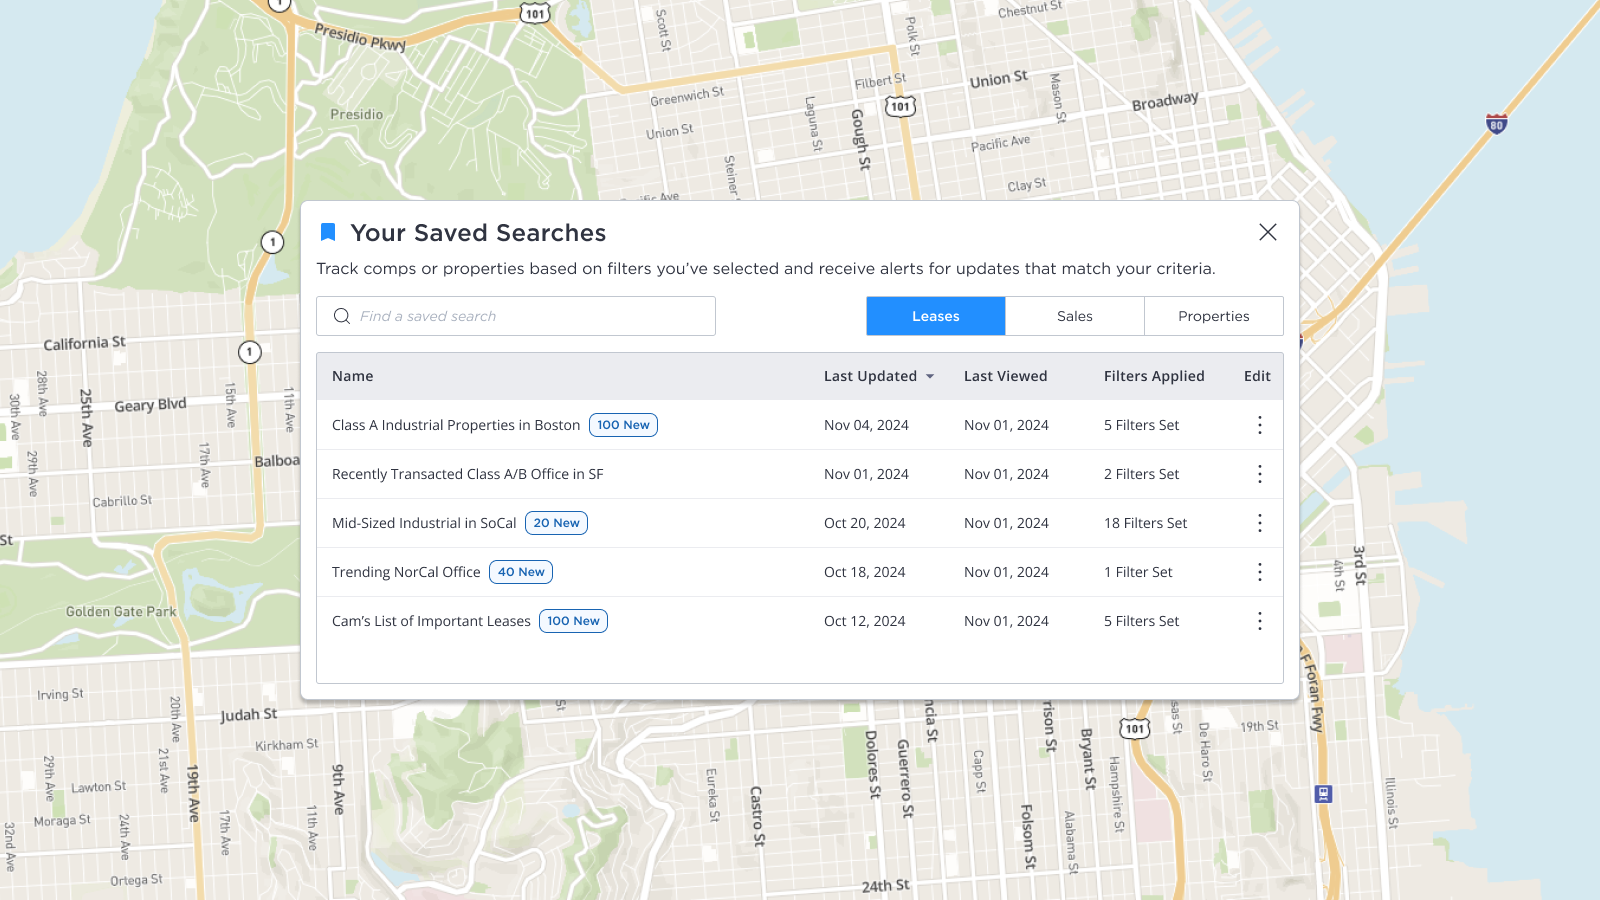
Before the redesign, the saved search feature was difficult to find, weekly email alerts often arrived too late, and users struggled to identify what information was truly new in a list of hundreds of comps. As a result, the feature underperformed despite its strategic importance based on conversations during user interviews.
I led the redesign of the saved-search experience to address these gaps. The new saved search solution improved visibility and workflow integration, and customizable alert cadences—including immediate notifications, daily summaries, and weekly digests. Through iterative testing, we ensured users could quickly spot new activity, trust the updates, and manage alerts in a way that fit their prospecting cadence and client workflows.CompStak is known in the Commercial Real Estate industry to be the primary source for office leases in the United States, with a heavy presence in primary markets such as New York City and San Francisco. COVID shifted the industry’s demand from office leases in primary markets to industrial leases across primary and secondary markets. This shift in demand revealed key challenges:
Key Outcomes & Business Impact
- Over 50% increase in monthly saved-search creation following launch, validating improved usability and visibility.
- 80% uplift in user engagement through more frequent alerts and easier access to updated information.
- 50% increase in user retention and account retention, including helping save one of our most critical high–six-figure accounts directly tied to the enhanced alert experience.
- 15% increase in decision-making time, as users can set to receive timely and clearly labeled updates (immediate, daily, or weekly).
- Strengthened platform stickiness, positioning CompStak as a daily operational tool rather than a periodic research destination.